24 Jan Mapping the Growth and Impact of Our Work
Explore the impactful work of Connect the Dots over the years through an interactive Project Map and filter tool.
Our Connect the Dots team is driven by impact. We work to connect all voices to decision making through meaningful engagement processes that drive real impact for people and projects.
With this in mind, we are excited to introduce the redesigned Recent Work page on our website that now features a Project Map, an interactive map and filter tool that visually shares our projects and impact.
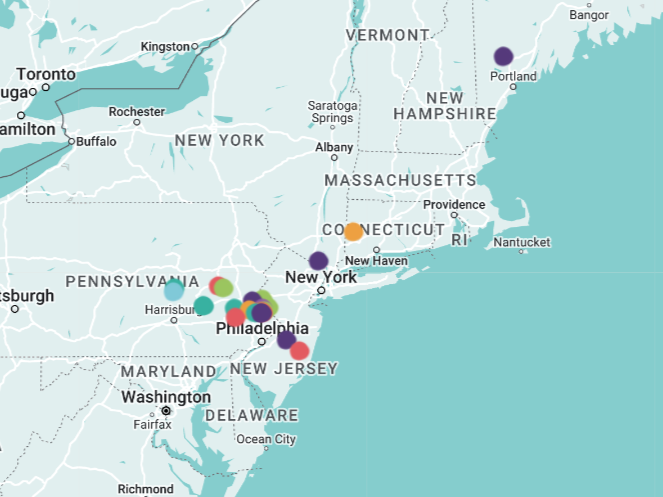
As our work and our team grows with exciting projects ahead, we wanted to take the time to visualize our impact over the past years – and track it going forward. We are an expanding small business and our projects have expanded too, not only in number but in types, sectors, city, and scale. The Project Map tool visually tracks the impact of our work which stretches beyond Pennsylvania into neighboring states along the east coast. It does this by displaying the locations, descriptions, and categories of each project with a color-coded “dot”.
Here’s how to use it:
First click on connectthedots.us/project-map/ or find it in the menu bar across the top of the website under “Our Work”. Once the page opens you’ll see a colorful key above a map designating a subject for our projects. You can search the list of projects two ways 1) by interacting with the map or 2) filtering through a list view. For both of these options, anytime you see a project with a “Learn more about this” link, you can open to a more in depth overview of the work we did.
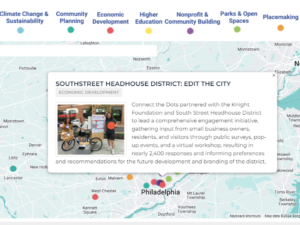
A short description and photo can be viewed by hovering over a dot on the map.
1) Navigate with the map:
- Use your cursor to zoom in or out of states to find projects that interest you by location or click on a dot with a color of a subject that you want to learn more about.
- Once you click on a project dot, you’ll see a short description and photo.
2) View as a list:
- Scroll down past the map and type keywords into the search bar to find project or make selections from the filter options for which types of projects you want to read about
Each year the Project Map will reflect where our work has taken us. We look forward to increasing the number of dots on the map as we continue to grow!